
Fourth- and Eighth-grade Mathematics and Eighth-grade Reading Scores Decline Compared to 2013; Fourth-grade Reading Score is Unchanged
& Video: Peggy Carr, Acting Commissioner, National Center for Education Statistics Institute of Education Sciences, U.S. Department of Education, and Terry Mazany, Chairman, National Assessment Governing Board

(Washington, D.C., Wednesday, October 28, 2015) – Average fourth- and eighth-grade mathematics scores and the average eighth-grade reading score declined between 2013 and 2015, according to The Nation’s Report Card released today. The average fourth-grade reading score was unchanged over the two-year period. In both grades, national mathematics and reading scores in 2015 are higher than those from the first assessments in the early 1990s.
The National Assessment of Educational Progress (NAEP)—also known as The Nation’s Report Card—is the largest nationally representative and continuing assessment of what students in the United States know and can do in various subject areas. NAEP is administered by the National Center for Education Statistics (NCES). It is frequently referred to as the ‘gold standard’ of student assessments.
National Results
In fourth-grade mathematics, the average scale score in 2015 was 240, a decline of one point from 2013. In eighth-grade mathematics, the average scale score in 2015 was 282, a decline of two points from 2013. The NAEP scale ranges from 0 to 500.
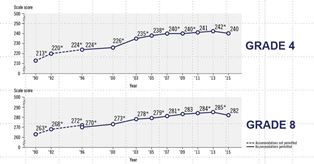
(Average NAEP mathematics scores over time)
* Significantly different (p < .05) from 2015.
Differences in scale scores may not sum to totals because of rounding.
The average reading score was statistically unchanged from 2013 for fourth-grade students. In 2015, the average eighth-grade reading score was 265, a decline of two points from 2013.
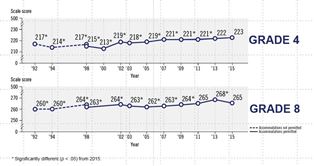
(Average NAEP reading scores over time)
* Significantly different (p < .05) from 2015.
Differences in scale scores may not sum to totals because of rounding.
The Nation’s Report Card also reports data by different demographic groups, such as Black, Hispanic, Asian/Pacific Islander, and American Indian/Alaska Native. None of the achievement gaps between White students and students in any of the other groups changed by a statistically significant margin from 2013 and 2015.
Although national results showed decreases in mathematics and grade 8 reading, the achievement of children in cities had no statistically significant changes since 2013 in either subject or either grade level.
Student performance on NAEP is also reported by achievement levels. There are three NAEP achievement levels: Basic, Proficient, and Advanced. Proficient on the NAEP scale represents competency over challenging subject matter.
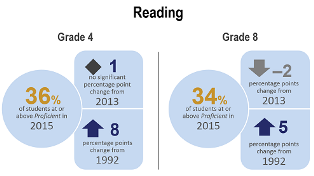
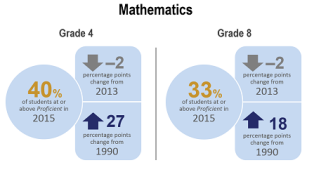
In 2015, there was a decrease in the percentage of students scoring at or above Proficient at both grades in mathematics, and for eighth-graders in reading when compared to 2013:
- In fourth-grade reading, 36 percent of students scored at or above Proficient (no significant change from 2013, and an eight percentage point increase since 1992).
- In eighth-grade reading, 34 percent of students scored at or above Proficient (a two percentage point decline from 2013, and a five percentage point increase since 1992).
- In fourth-grade math, 40 percent of students scored at or above Proficient (a two percentage point decline from 2013, and a 27 percentage point increase since 1990).
- In eighth-grade math, 33 percent of students scored at or above Proficient (a two percentage point decline from 2013, and an 18 percentage point increase since 1990).
State Results
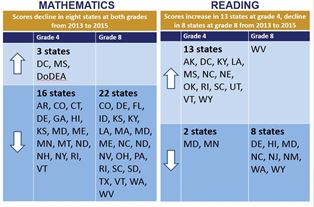
State results are varied, with some states making gains, though the majority of states saw declines in either one or both grades in mathematics. In fourth grade, two jurisdictions (the District of Columbia and Mississippi) made score gains in both subjects between 2013 and 2015. The District of Columbia, Mississippi, and the U.S. Department of Defense schools (DoDEA) saw score increases in fourth-grade math in 2015 and 16 states saw score declines when compared to 2013. In fourth-grade reading, scores in 13 states increased and scores declined in two states. At grade 8, no state made score gains in mathematics and 22 states saw score declines. One state (West Virginia) made score gains in reading between 2013 and 2015 and eight states saw score declines.
Urban District Results
The Nation’s Report Card also measures progress in some of America’s urban school districts through the Trial Urban District Assessment (TUDA) program. Fourth- and eighth-graders in 21 urban districts participated in the mathematics and reading assessments in 2015. Average scores for large cities, used as a benchmark for comparing results for districts, held steady over the two-year period since the last assessment in both grades and subjects.
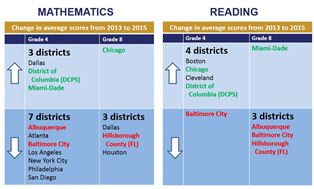
Average scores increased in both subjects in three districts at either grade 4 or grade 8—the District of Columbia (DCPS), Miami-Dade, and Chicago:
- Average scores for the District of Columbia Public Schools increased between 2013 and 2015 in both subjects in fourth grade.
- Average scores for Miami-Dade increased in fourth-grade math and eighth-grade reading.
- Average scores for Chicago increased for eighth-grade math and fourth-grade reading.
(Legend: States highlighted in green had increases in more than one subject and/or grade. States highlighted in red had decreases in more than one subject and/or grade.)
The 2015 math and reading assessments were given to fourth- and eighth-graders in public and private schools in all 50 states, the District of Columbia, and U.S. Department of Defense schools. State scores are for public schools only. In 2015, 279,000 fourth-graders from 7,900 schools and 273,000 eighth-graders from 6,200 schools participated in the assessment. Samples of schools and students are drawn from each state and from the District of Columbia and Department of Defense schools.
Visit http://nationsreportcard.gov/reading_math_2015/ to view the report.